- Details
- Written by: ofurpaur
- Category: Climate Change and Sea Ice
- Hits: 1318
The Paris Agreement is a legally binding international treaty on climate change. It was adopted by 196 Parties at the UN Climate Change Conference (COP21) in Paris, France, on 12 December 2015. It entered into force on 4 November 2016.
Its overarching goal is to hold “the increase in the global average temperature to well below 2°C above pre-industrial levels” and pursue efforts “to limit the temperature increase to 1.5°C above pre-industrial levels.” However, in recent years, world leaders have stressed the need to limit global warming to 1.5°C by the end of this century. That is because the UN’s Intergovernmental Panel on Climate Change indicates that crossing the 1.5°C threshold risks unleashing far more severe climate change impacts, including more frequent and severe droughts, heatwaves, and rainfall. To limit global warming to 1.5°C, greenhouse gas emissions must peak before 2025 at the latest and decline 43% by 2030. The Paris Agreement is a landmark in the multilateral climate change process because, for the first time, a binding agreement brings all nations together to combat climate change and adapt to its effects.
How does the Paris Agreement work?
Implementation of the Paris Agreement requires economic and social transformation, based on the best available science. The Paris Agreement works on a five-year cycle of increasingly ambitious climate action -- or, ratcheting up -- carried out by countries. Since 2020, countries have been submitting their national climate action plans, known as nationally determined contributions (NDCs). Each successive NDC is meant to reflect an increasingly higher degree of ambition compared to the previous version.
Recognizing that accelerated action is required to limit global warming to 1.5°C, the COP27 cover decision requests Parties to revisit and strengthen the 2030 targets in their NDCs to align with the Paris Agreement temperature goal by the end of 2023, taking into account different national circumstances.
How do they track progress?
With the Paris Agreement, countries established an enhanced transparency framework (ETF). Under ETF, starting in 2024, countries will report transparently on actions taken and progress in climate change mitigation, adaptation measures and support provided or received. It also provides for international procedures for the review of the submitted reports.
The information gathered through the ETF will feed into the Global stocktake which will assess the collective progress towards the long-term climate goals.
This will lead to recommendations for countries to set more ambitious plans in the next round.
What has been achieved so far?
Although climate change action needs to be massively increased to achieve the goals of the Paris Agreement, the years since its entry into force have already sparked low-carbon solutions and new markets. More and more countries, regions, cities and companies are establishing carbon neutrality targets. Zero-carbon solutions are becoming competitive across economic sectors representing 25% of emissions. This trend is most noticeable in the power and transport sectors and has created many new business opportunities for early movers.
By 2030, zero-carbon solutions could be competitive in sectors representing over 70% of global emissions.
Read more about the Paris Agreement
United Nations / Climate Change Website
Source: UN
- Details
- Written by: ofurpaur
- Category: Climate Change and Sea Ice
- Hits: 2295
Issued annually, the Arctic Report Card is a timely source for clear, reliable and concise environmental information on the state of the Arctic, relative to historical time series records.
Material presented in the Report Card is prepared by an international team of scientists. The Arctic Report Card is collaboratively supported by the international Arctic Council.
The Conservation of Arctic Flora and Fauna (CAFF) Circumpolar Biodiversity Monitoring Program (CBMP) provides collaborative support through the delivery and editing of the biological elements of the Report Card.
The NOAA (National Oceanic and Atmospheric Administration) issues the Arctic Report Card annually The Arctic Report Card is a timely source for clear, reliable and concise environmental information on the state of the Arctic, relative to historical time series records.
The 2012 Report Card describes dramatic changes in the Arctic. The Arctic Council working groups CAFF and AMAP supported work on the 2012 Report Cards, which detail dramatic changes in the Arctic with record losses of sea ice and late spring snow.
The peer-reviewed report contains contributions from 141 authors from 15 countries. For this year's issue CAFF's CBMP developed and edited the terrestrial and marine ecosystem chapters in cooperation with others, while AMAP organized an independent peer-review process involving international experts.
Click here to go to the Reports website.
Full report is available here.
The Arctic region continued to break records in 2012—among them the loss of summer sea ice, spring snow cover, and melting of the Greenland ice sheet. This was true even though air temperatures in the Arctic were unremarkable relative to the last decade, according to the report.
Major findings include:
- Snow cover: A new record low snow extent for the Northern Hemisphere was set in June 2012, and a new record low was reached in May over Eurasia.
- Sea ice: Minimum Arctic sea ice extent in September 2012 set a new all-time record low, as measured by satellite since 1979.
- Greenland ice sheet: There was a rare, nearly ice sheet-wide melt event on the Greenland ice sheet in July, covering about 97 percent of the ice sheet on a single day.
- Vegetation: The tundra is getting greener and there's more above-ground growth. During the period of 2003-2010, the length of the growing season increased through much of the Arctic.
- Wildlife and food chain: In northernmost Europe, the Arctic fox is close to extinction and vulnerable to the encroaching Red fox. Additionally, massive phytoplankton blooms below the summer sea ice suggest estimates of biological production at the bottom of the marine food chain may be ten times too low.
- Ocean: Sea surface temperatures in summer continue to be warmer than the long-term average at the growing ice-free margins, while upper ocean temperature and salinity show significant interannual variability with no clear trends.
- Weather: Most of the notable weather activity in fall and winter occurred in the sub-Arctic due to a strong positive North Atlantic Oscillation. There were three extreme weather events including an unusual cold spell in late January to early February 2012 across Eurasia, and two record storms characterized by very low central pressures and strong winds near western Alaska in November 2011 and north of Alaska in August 2012.
- Details
- Written by: ofurpaur
- Category: Climate Change and Sea Ice
- Hits: 2518
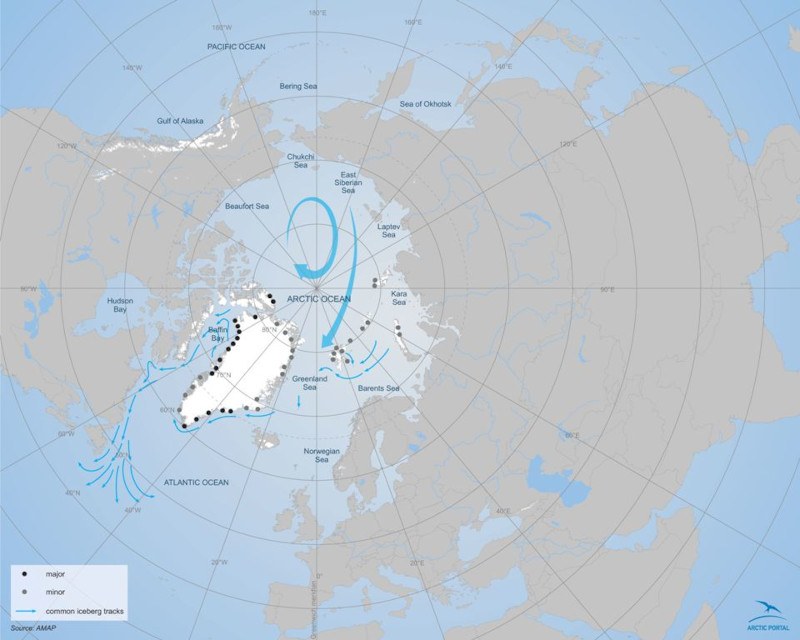
Blocks of sea ice break annually from large ice caps in the Arctic. These blocks of ice can be up to kilometers in width. The ice blocks cause problems where they go.
As the map shows, the largest blocks break off Greenland. Click on the map to enlarge.
The blocks break off both from the east coast and the west coast. The ocean currents then control where these block go, some of them the size of apartment buildings.
The blocks from Greenland tend to search south, affecting Canada and Iceland.
Sea ice makes sailing dangerous, and the block can drift far south. Smaller ships are often in danger because of the ice. Large ships can often be affected as well; the Titanic is the famous example.
There is also ice that drifts from the Russian Arctic and from Svalbard. That ice often melts before reaching Icelandic shores.
Blocks of ice melt in time but they have on a few occasions brought polar bears to Iceland, for example. They come from Svalbard and Greenland for the most part.
In 2008 two polar bears drifted to Iceland, one in 2010 and one in 2011. They were all shot consequently.
Source: NSIDC
- Details
- Written by: ofurpaur
- Category: Climate Change and Sea Ice
- Hits: 1252
A website by the university of Illinois, USA, allows users to compare sea ice extent between exact dates since 1979.
The user-friendly website clearly demonstrates the sea ice extent with data from the National Center for Environmental Prediction/NOAA, NSIDC, U. Bremen.
By selecting two different dates comparison can be made between pictures that show the extent.
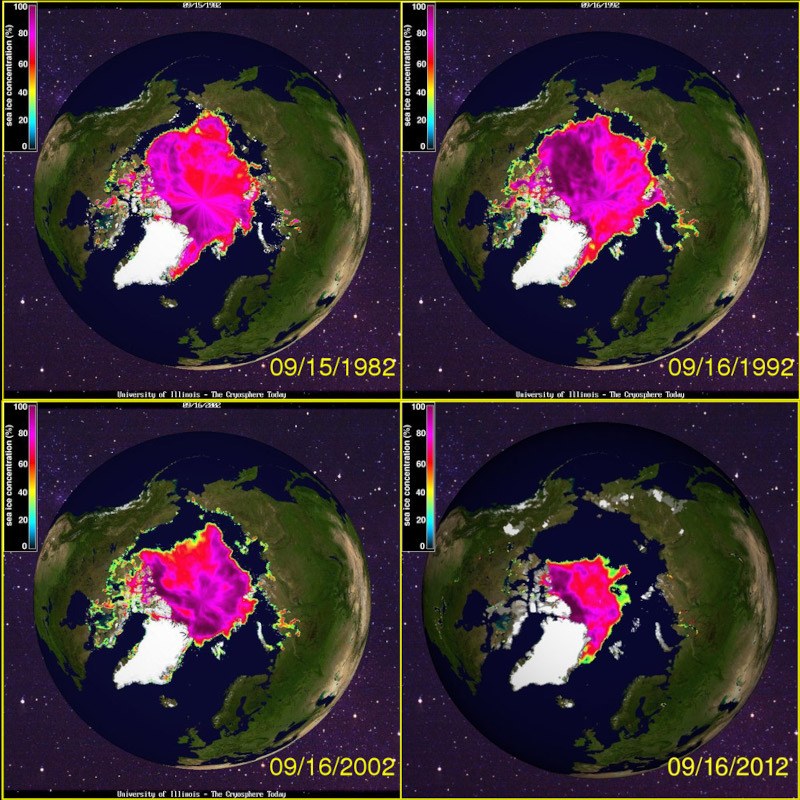
The picture on the left actually shows four pictures, but the system compares two. The picture, expandable by clicking on it, shows the sea ice on August 19th in 1982, 1992, 2002 and 2012.
Comparing even the last 10 years shows incredible changes in the sea ice extent.
The website also demonstrates all the pictures in a video showing the extent from 1978-2006.
Click here to go to the system on the website Cryosphere Today.
- Details
- Written by: ofurpaur
- Category: Climate Change and Sea Ice
- Hits: 2101
The summer of 2012 saw the record low ice extent in the Arctic ocean, since the beginning of satellite data record ranging back to 1979 as well as other recorded data ranging back to the 50's.
The previous record low occurred in 2007.
Sea ice coverage in 2012 also remains below normal everywhere except the East Greenland Sea.
NASA study finds that perennial sea ice in the Arctic is melting faster than previously thought -- at a rate of 9 percent per decade. If these melting rates continue for a few more decades, the perennial sea ice will likely disappear entirely within this century, due to rising temperatures and interactions between ice, ocean and the atmosphere that accelerate the melting process.
On September 16, 2012 sea ice extent dropped to 3.41 million square kilometers, 760,000 square kilometers below the previous record minimum extent in the satellite record, which occurred on September 18, 2007.
That means there less ice in the Arctic which would cover all of Norway, Denmark and Finland combined.
Compared to September conditions in the 1980s and 1990s, this represents a 45% reduction in the area of the Arctic covered by sea ice. Typically, the melt season ends around the second week in September.
In 2012, the rate of ice loss for August was 91,700 square kilometers per day, the fastest observed for the month of August over the period of satellite observations. In August 2007, ice was lost at a rate of 66,000 square kilometers per day, and in 2008, the year with the previous highest August ice loss, the rate was 80,600 square kilometers per day. This shows that the melt is faster then ever.
In a 2008 article titled, Recent radical shifts of atmospheric circulations and rapid changes in Arctic climate system Zhang et al. show that the extreme loss of Arctic sea ice since 2001 has been accompanied by a radical shift of the Arctic atmospheric circulation patterns, into a new mode they call the Arctic Rapid change Pattern. The new atmospheric circulation pattern has also been recognized by other researchers, who refer to it as the Arctic Dipole (Richter-Menge et al., 2009).